August 2022

August 2022 Weather Impact Report


pellucid_aug22_weathermap2 final.jpg
(Click the map to view full screen)

Green arrow = GPH are UP >2% vs. 1 year ago | Red arrow = GPH are DOWN >-2% vs. 1 year ago
HIGH: Gulf Coast: 31.3%                       LOW: Desert SW Coast: -9.6%

pellucidsmartbuy.png
Interested in more from Pellucid?

Click here  to view the latest NGCOA Smart Buy Marketplace offer you can take advantage of from Pellucid's NEW, comprehensive Golf Market Research Center (GMRC).

This web-based, facility performance tracking tool will give you a leg up on the competition based on four separate business-critical reports.

Latest Accelerate Discussions

Log in to see this information

Either the content you're seeking doesn't exist or it requires proper authentication before viewing.

PRIOR WEATHER IMPACT REPORTS FROM 2021:

FEBRUARY  |  APRIL  |  JUNE  
AUGUST  |  SEPTEMBER  |  OCTOBER

PRIOR WEATHER IMPACT REPORTS FROM 2022:

JANUARYFEBRUARYMARCH | APRIL MAYJUNE |

JULY


Pellucid_GPH_AUG_22.png
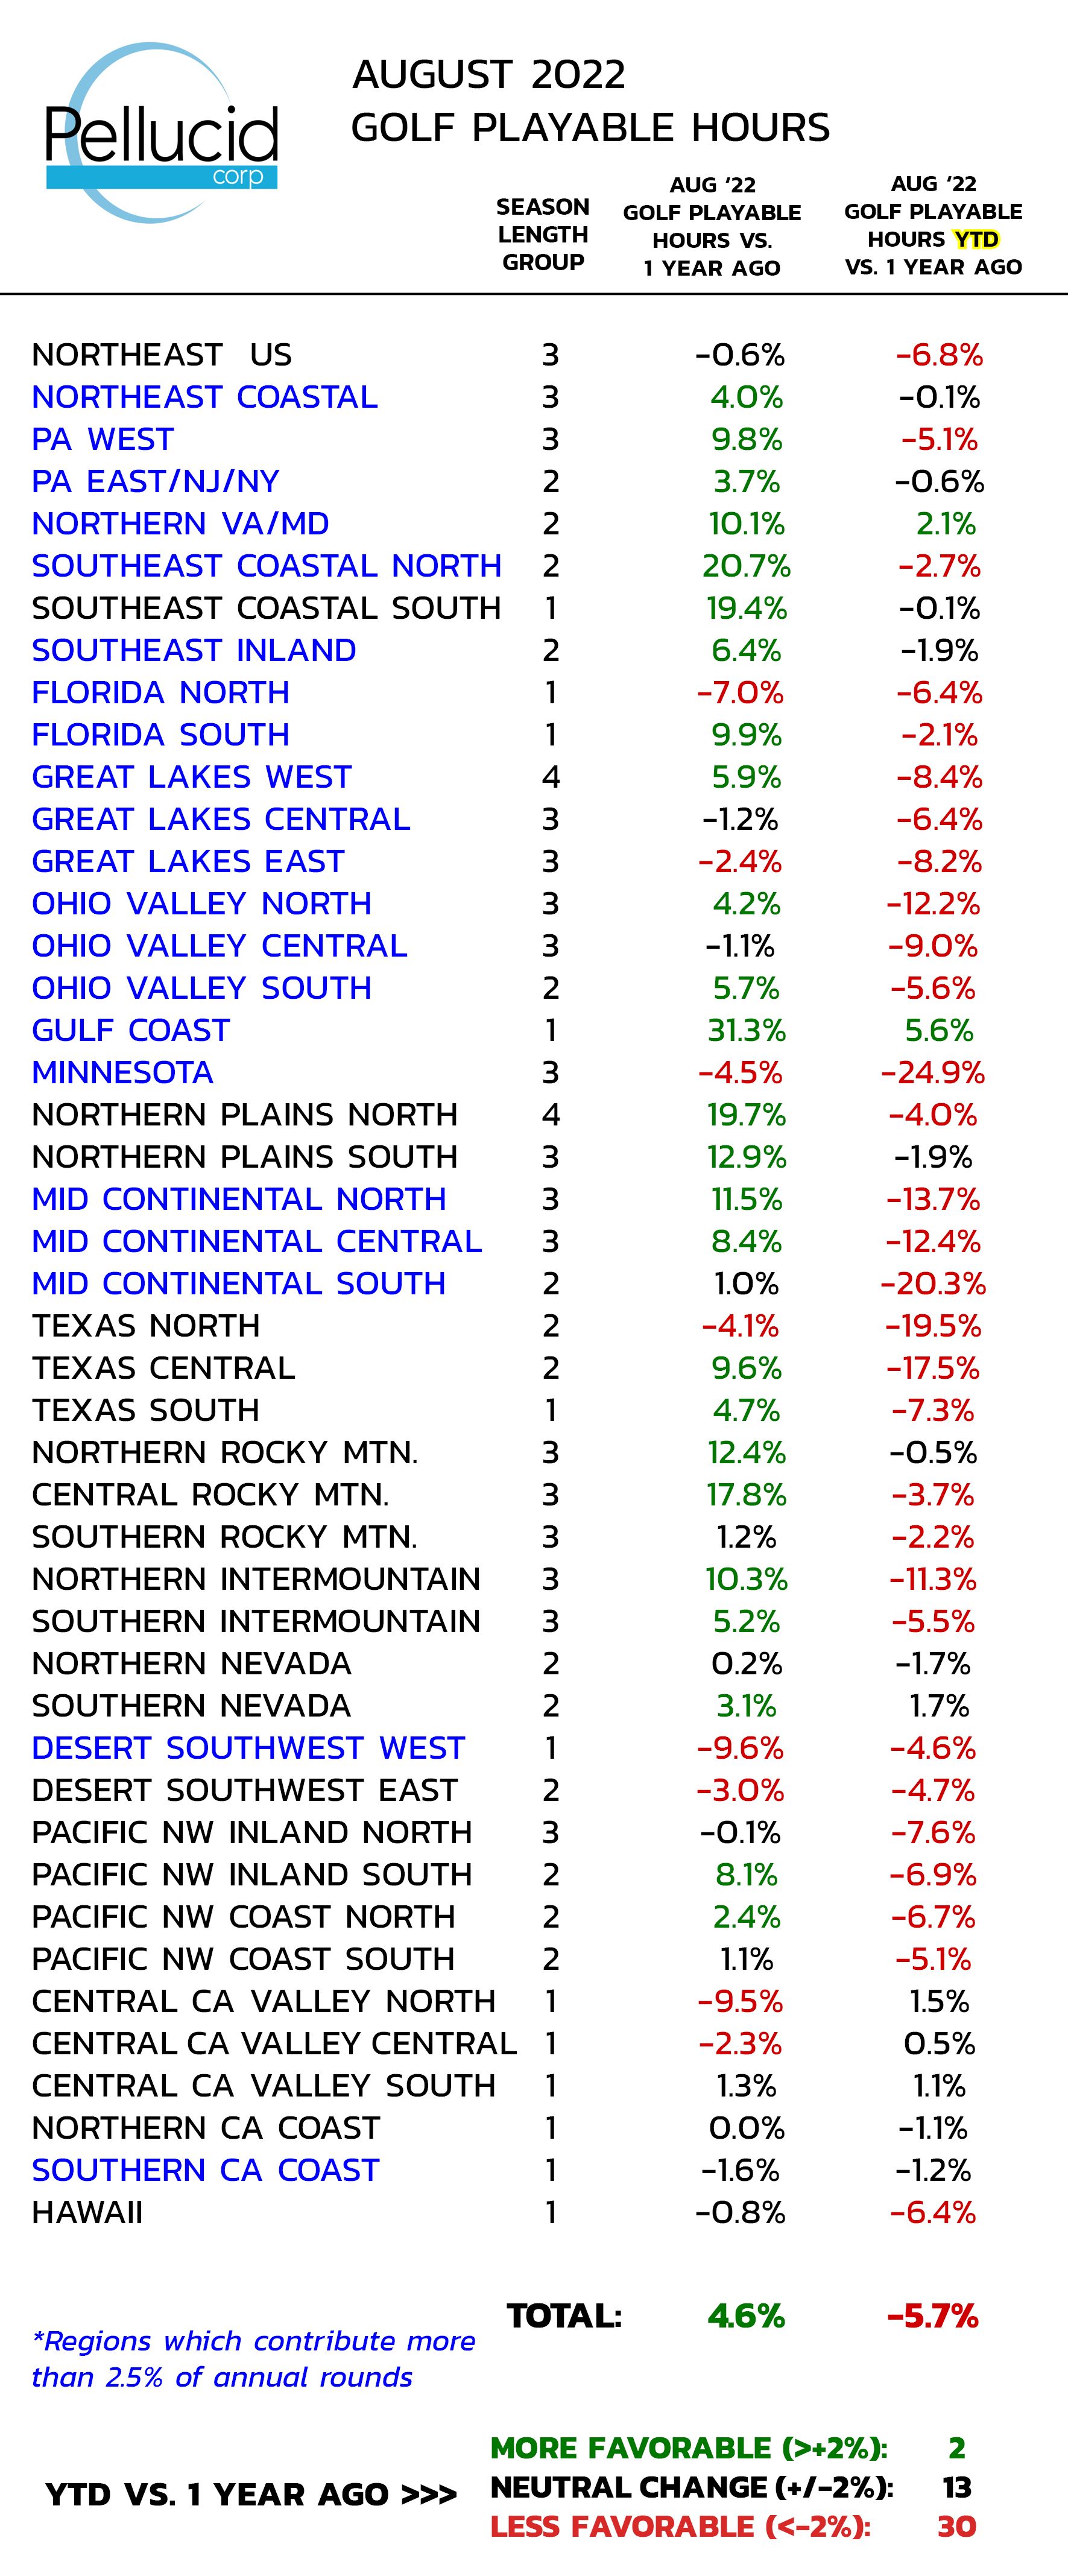
Season length groups 
1= 12 months, 2= 9-11 months,
3= 7-8 months, 4= <7 months


- N/A reported for <9 month season geographics for early Q1 + late Q4 months due to instability

- GPH based on Pellucid-defined rules for golf season days, daylight hours, & weather factors
- Nat'l % Utilization Rate is reported actual rounds/weather-adjusted capacity rounds, compared to prior year annual % Utilization Rate
- Day-of-Week GPH is weighted by both geographic contribution and Pellucid avg. of Rds/Rev contribution by individual day-of-week
- Percentages are capped at +100% // -100% for off-season geographics due to low base sizes
- N/A means no GPH for one or both of the reported periods

- Regions are Weatherbank defined geographies based on climate including topography & maritime influences